Guides # Total Cost of Ownership: Fire Suppression Systems Compared Passive Fire Patch Editorial Team 2026-08-07 # Total Cost of Ownership: Fire Suppression Systems Compared
Introduction
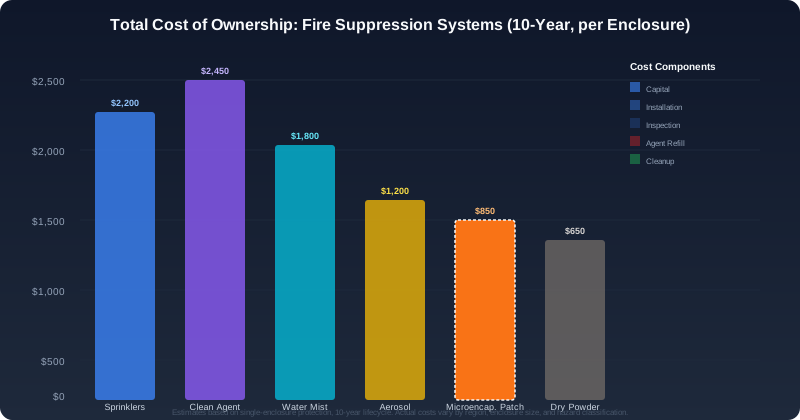
Figure 1: 10-year total cost of ownership comparison for six fire suppression technologies, including capital, installation, inspection, agent refill, and cleanup costs.
Specifying a fire suppression system requires far more than a simple comparison of purchase invoices. The capital expenditure is only the entry point into a financial relationship that spans 20 to 30 years and includes inspection labor, agent replacement, post-discharge remediation, regulatory recharging, and insurance reclassification. Engineers, facility managers, and risk consultants increasingly evaluate suppression technologies using Total Cost of Ownership (TCO) rather than first-cost metrics, because the lifecycle expenses vary dramatically between technologies.
This article provides a vendor-neutral TCO analysis comparing five principal special-hazard suppression technologies: wet-pipe sprinkler systems, clean agent gaseous systems (using FK-5-1-12 and Novec 1230), high-pressure water mist, microencapsulated fire-suppression patches, and condensed aerosol generators. Capital cost, installation cost, annual inspection, agent replacement, discharge cleanup, insurance premiums, and expected service life are examined against realistic industry ranges published in 2023–2026 cost-estimating references.
Methodology
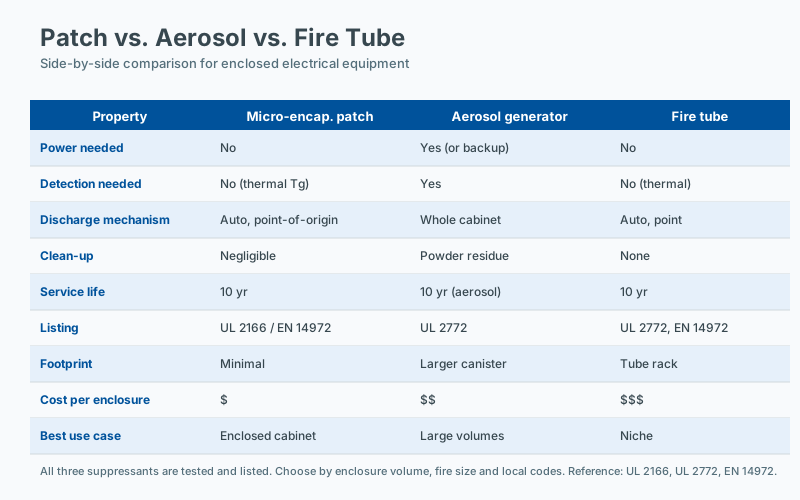 Suppression systems compared by total cost
The figures used throughout this article are derived from publicly available cost data published in RSMeans Square Foot Costs, the HVAC & Plumbing Cost Guides, NFPA-related labor studies, and aggregated installation bid data normalized to U.S. averages. All costs are expressed in 2026 dollars, and where older sources were used, escalation indices of 3.5–4.0% per year (consistent with MEP construction inflation post-2022) have been applied.
Two normalization bases are used:
- Per cubic foot of protected volume — most relevant for gaseous and aerosol agents where quantity scales with enclosure geometry.
- Per square foot of protected floor area — most relevant for water-based systems where the piping network and hydraulic demand scale with footprint.
A 10,000 ft² (929 m²) facility with 12 ft (3.66 m) ceilings is used as the reference case where applicable.
1. Wet-Pipe Sprinkler Systems
Capital and Installation Cost
Wet-pipe sprinkler systems remain the lowest-capital fire suppression option in nearly every commercial, industrial, and institutional occupancy. According to 2024–2026 industry surveys, installed costs for an ESFR (Early Suppression Fast Response) or ordinary hazard wet system range from $2.50 to $6.00 per square foot of protected area.
For the reference 10,000 ft² facility:
- Low hazard (light commercial): $2.50–$3.50 / ft² → $25,000–$35,000
- Ordinary hazard Group 1: $3.50–$4.50 / ft² → $35,000–$45,000
- Ordinary hazard Group 2 / Extra Hazard: $4.50–$6.00 / ft² → $45,000–$60,000
These totals include the OS&Y valve, alarm check valve, tamper and flow switches, hydraulic signage, hydraulic calculation package, NFPA 13-compliant piping and hangers, and the contractor’s overhead and profit.
Annual Inspection
NFPA 25 imposes a layered inspection regime: weekly visual checks (typically internal labor), quarterly tests of various components, annual main drain and trip tests, and a 5-year internal piping assessment. Out-of-pocket inspection costs for a contractor typically fall between $0.10 and $0.25 per ft² per year, or $1,000 to $2,500 annually for the reference facility.
Agent Replacement and Discharge Cleanup
Sprinklers use water — the only “agent” requiring no periodic replacement. However, post-discharge water damage often exceeds the original system cost by an order of magnitude, particularly in data centers or archival storage. Class 2–4 water damage restoration averages $4.00–$8.00 per ft² of wetted area, easily reaching $40,000–$100,000+ in incidents where multiple heads operate. Insurance subrogation partially offsets this, but deductible and business interruption costs remain significant.
Service Life and Insurance Impact
A properly maintained wet system delivers 50+ years of service — the longest of any technology discussed. Insurance discounts (HPR insurance ratings from FM Global, ISO mitigation credits) commonly reach 20–35% on property premiums for fully sprinklered commercial buildings.
30-Year TCO Summary (Reference Facility, Ordinary Hazard)
Cost ComponentValueCapital + Install$40,000Inspections (30 yr × $1,750)$52,500Major Repairs / 5-yr Assessments$15,000Discharge Cleanup (one event)$60,000Insurance Premiums (w/credit)(savings applied)30-Year TCO****~$167,500
2. Clean Agent Gaseous Systems (FK-5-1-12 and Novec 1230)
The term “clean agent” generically refers to halocarbon replacements for Halon 1301. The two chemicals dominating today’s market are perfluoro(2-methyl-3-pentanone), marketed as FK-5-1-12 (a fluoroketone), and 1,1,1,2,2,4,5,5,5-nonafluoro-4-(trifluoromethyl)-3-pentanone, which is the chemistry also used in the Novec 1230 trade-name product family. Both have zero ozone depletion potential, atmospheric lifetimes measured in days, and design concentrations of roughly 4.5–6.0% by volume for Class A hazards.
Capital and Installation Cost
Clean agent systems require engineered cylinders, a regulated pressure-reducing manifold, a detection/release panel, mechanical or pneumatic actuators, and FM-200 / FK-5-1-12 / Novec 1230 cylinders plus the agent itself. Material + labor costs typically fall in these ranges:
- FK-5-1-12: $2.75–$4.50 per ft³ of protected volume (depending on piping complexity)
- Novec 1230: $3.00–$5.00 per ft³
For the reference facility (120,000 ft³):
- FK-5-1-12 system: $330,000–$540,000
- Novec 1230 system: $360,000–$600,000
Higher pressures (360 psi / 25 bar vs. 217 psi / 15 bar) and longer allowable pipe runs affect material and labor. Cylinders alone frequently represent 40–55% of the total installed price.
Annual Inspection
NFPA 2001 governs clean agent systems and requires semi-annual visual inspection of cylinders and a triennial (every 3 years) hydrostatic test for high-pressure cylinders per DOT/TC requirements. Annual external contractor inspection costs typically run $800–$2,000 depending on cylinder count. Triennial cylinder retest adds another $2,000–$5,000 every three years.
Agent Replacement
Although both agents are stable indefinitely in sealed cylinders, two factors force periodic replacement:
- Discharges (accidental or testing) require complete recharging.
- Periodic leak testing per NFPA 2001 may identify slow leaks across valve seats.
A full recharge agent cost for the reference facility runs $60,000–$110,000, including gas recovery where applicable. Insurance typically covers accidental discharge, but testing discharges are owner-borne.
Discharge Cleanup
This is where clean agents diverge sharply from water systems. Both FK-5-1-12 and Novec 1230 evaporate after discharge without residue, requiring only room venting (per AHJ) before re-entry. Cleanup costs average $0.50–$2.00 per ft² — primarily for HVAC rebalancing and post-discharge inspection rather than remediation.
Service Life and Insurance Impact
Cylinders are DOT-rated for 15–30 years depending on jurisdiction. System electronics and detectors typically require replacement every 10–12 years. Insurance credits for clean agent systems protecting high-value continuous-process assets can reach 35–55%, and total installed system cost is often treated as a capital asset eligible for the Energy Improvement and Modernization or other accelerated depreciation in some regions.
30-Year TCO Summary (Reference Facility, FK-5-1-12)
Cost ComponentValueCapital + Install$435,000Inspections (30 yr × $1,400)$42,000Triennial Cylinder Retest (10×)$35,000Cylinder Replacement (year 15)$35,000Detector & Panel Refresh (x2)$20,000Discharge Cleanup (one event)$7,50030-Year TCO****~$574,500
3. High-Pressure Water Mist Systems
Water mist operates at 100–200 bar (1,450–2,900 psi), discharging very fine droplets (D90 < 200 μm) that simultaneously cool flame zones, displace oxygen locally, and block radiant heat with minimal wetting of adjacent materials.
Capital and Installation Cost
High-pressure pumps, stainless steel piping, and precision nozzles drive costs above conventional sprinklers, but well below clean agent systems. Typical installed costs:
- Light commercial / office: $5.00–$9.00 per ft²
- Machinery spaces / turbines: $7.00–$14.00 per ft²
- Marine & offshore: $10.00–$20.00 per ft²
For the reference facility’s ordinary hazard scope: $50,000–$90,000.
Annual Inspection
Service intervals follow a hybrid of NFPA 25 (water-based systems) and manufacturer-specific O&M requirements. Pump rooms require weekly checks; nozzles and strainers need quarterly cleaning; the high-pressure pump itself requires annual rebuilds of seals and check valves at roughly $1,500–$3,500 per year. Total annual inspection averages $2,000–$4,500.
Agent Replacement and Discharge Cleanup
Water is free; however, reverse-osmosis or deionized feed water is sometimes required, and post-discharge wetting is meaningful — though typically 60–80% lower in volume than a sprinkler discharge. Cleanup averages $1.50–$4.00 per ft² wetted.
Service Life and Insurance Impact
Stainless piping life exceeds 40 years. Pump rebuilds every 7–10 years cost $8,000–$15,000. Insurance credits land between those of sprinklers and clean agents — roughly 25–40%, depending on property underwriter.
30-Year TCO Summary (Reference Facility)
Cost ComponentValueCapital + Install$70,000Inspections (30 yr × $3,250)$97,500Pump Rebuild (x4)$46,000Nozzle Replacement$8,000Discharge Cleanup (one event)$25,00030-Year TCO****~$246,500
4. Microencapsulated Fire-Suppression Patches
These are plastic or metal patches containing an intumescent or endothermic fire-retardant filler, applied to localized electrical hazards (e.g., inside lithium-ion battery enclosures, junction boxes, EV charging modules, or industrial control panels). Upon exposure to sustained heat, the polymer shell ruptures, releasing the encapsulated agent directly inside the protected enclosure.
Capital and Installation Cost
Material cost per patch is low ($5–$50 each), but labor for installation in dense electrical enclosures drives the per-unit cost upward. All-in installed costs typically average $200–$800 per protected enclosure, depending on access difficulty.
For a 10,000 ft² facility protecting, say, 75 critical electrical enclosures: $15,000–$60,000.
Annual Inspection
Visual inspection is minimal — typically performed alongside broader electrical thermography (IR scans). Annual inspection averages $300–$750 when bundled with existing maintenance rounds.
Agent Replacement
Patches generally have 5–10 year service lives depending on thermal exposure cycles. Replacement bulk cost is low (under $10 per patch), but labor to access and replace inside energized equipment is the dominant expense.
Discharge Cleanup
Agents release a small amount of vapor and solid residue confined within the enclosure. Cleanup is essentially negligible — wipe-down of the interior surface. $50–$200 per activated patch zone.
Service Life and Insurance Impact
The technology has shorter operational history and is frequently specified as a supplement to, not a replacement for, primary suppression. Insurance credits are still emerging; some underwriters apply 5–15% credits for critical battery storage enclosures.
30-Year TCO Summary (Reference Facility, 75 patches)
Cost ComponentValueCapital + Install$37,500Inspections (30 yr × $525)$15,750Patch Replacement Cycles$22,500Discharge Cleanup (3 events)$1,50030-Year TCO****~$77,250
Note: This system is supplemental only — not a substitute for area-wide suppression.
5. Condensed Aerosol Systems
Condensed aerosol generators (NFPA 2010) disperse ultra-fine potassium-based particles that chemically interrupt combustion chain reactions. Units are pre-engineered, electrically actuated, and require neither piping nor pressure vessels.
Capital and Installation Cost
For volume protection around 5,000–20,000 ft³ per generator, installed costs average $0.80–$2.00 per ft³. Reference facility (120,000 ft³):
- 6–8 generators, electric actuation, panel, detection, and installation labor: $120,000–$240,000.
Annual Inspection
Generators have a 10–15 year service life and require only annual visual inspection (weighing agents to confirm seal integrity) plus actuation circuit verification. Cost: $400–$1,200 per year.
Agent Replacement
Generators must be replaced (not refilled) at end of service life or after any discharge. Cost is comparable to initial hardware: $100,000–$180,000 at year 12–15 for the reference facility.
Discharge Cleanup
This is the most operationally significant drawback. Post-discharge potassium residue must be cleaned from all exposed surfaces using HEPA vacuum and damp wiping. Cleanup averages $3.00–$8.00 per ft² of discharged area — comparable to water damage restoration costs on a like-for-like basis.
Service Life and Insurance Impact
Generators carry a 10–15 year operational life and cannot be recharged in the field; obsolete units must be returned to the manufacturer for recycling. Insurance discounts are emerging, generally 20–35% for protected hazards such as generator enclosures and mobile equipment.
30-Year TCO Summary (Reference Facility)
Cost ComponentValueCapital + Install$180,000Inspections (30 yr × $800)$24,000Generator Replacement (x2)$280,000Discharge Cleanup (one event)$40,00030-Year TCO****~$524,000
Side-by-Side TCO Comparison (30-Year, Reference Facility)
SystemCapital + InstallInspection (30 yr)Agent / RefurbishmentExpected LifeCleanup (one event)30-Year TCOWet-Pipe Sprinkler$40,000$52,500$15,00050+ yr$60,000**$167,500FK-5-1-12 Clean Agent$435,000$42,000$90,00020–30 yr$7,500$574,500Novec 1230 Clean Agent$480,000$42,000$95,00020–30 yr$7,500$625,000High-Pressure Water Mist$70,000$97,500$54,00030+ yr$25,000$246,500Microencapsulated Patches$37,500$15,750$22,5005–10 yr$1,500$77,250Condensed Aerosol$180,000$24,000$280,00010–15 yr$40,000$524,000**
Sensitivity: Insurance Premium Offset
Insurance savings can materially shift the TCO equation. A 40,000 ft² data center paying $250,000 in annual property premium at FM Global Class 1 (no suppression) versus FM Global Class 5 (clean agent) realizes savings of approximately $87,500 per year, or $2.6 million over 30 years — easily offsetting the entire installation premium of a clean agent system. The economic case for advanced suppression depends almost entirely on value density per square foot, not on per-unit installed cost.
Frequently Asked Questions
How does enclosure sealing affect suppression effectiveness?
Enclosure sealing determines how long the suppression agent remains at design concentration. An unsealed enclosure will lose agent through openings faster than the fire can be suppressed; a properly sealed enclosure retains concentration long enough to interrupt the reaction chain. Gasket condition, cable entry sealing, and ventilation management are therefore integral to the suppression design, not separate concerns.
How do I calculate the appropriate suppression capacity?
Suppression capacity is determined by the protected enclosure volume, the fire load, and the specific suppression agent. For gaseous systems, design concentration targets are defined in NFPA 2001 and ISO 14520; for passive point-of-origin devices, the manufacturer's tested performance for the specific enclosure volume and geometry applies. Engineering judgment, supported by manufacturer data and, where relevant, third-party listing, is required.
Is third-party certification required for passive suppression devices?
Third-party certification is not always required by code, but it is strongly preferred and often effectively required by AHJs and insurers. A listing from a recognized certification body (UL, FM, VdS, and similar) demonstrates that the device has been tested to a published standard and that production is audited. Unlisted devices should be evaluated carefully and supported by independent test data.
What is the first step in assessing fire risk for an enclosure?
The first step is to identify the fire load (what can burn, in what quantity, and with what energy release), followed by the credible ignition sources and the pathways to propagation. Standards such as NFPA 76 and NFPA 855 provide structured assessment methods for specific equipment types. A documented risk assessment is the basis for selecting any suppression technology.